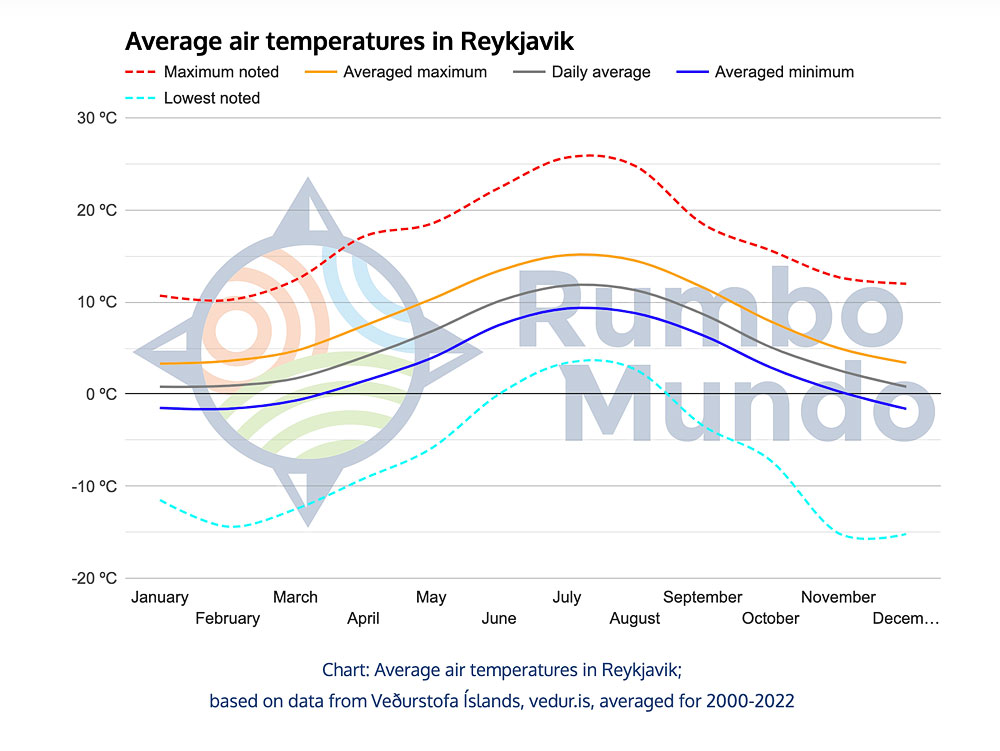


As we mentioned in the article about weather in Iceland, the climate or weather in different corners of Iceland differs. And although these differences are rather limited, they are interesting and sometimes even significant. Therefore, below we will discuss the most important ones in comparison with Reykjavik.
If you are interested in the weather in the south of Iceland and around Reykjavik, take a look at the article Weather in Iceland – temperature, wind, precipitation. That article is based on an analysis of weather data from the south and southwest of Iceland.
Weather in the West Fjords
The West Fjords are famous as the most beautiful, but also the most weather-challenged corner of Iceland. And the statistics largely confirm this, although the situation is more complicated than many might expect. In the analysis, we rely on data from the region’s capital, Ísafjörður.
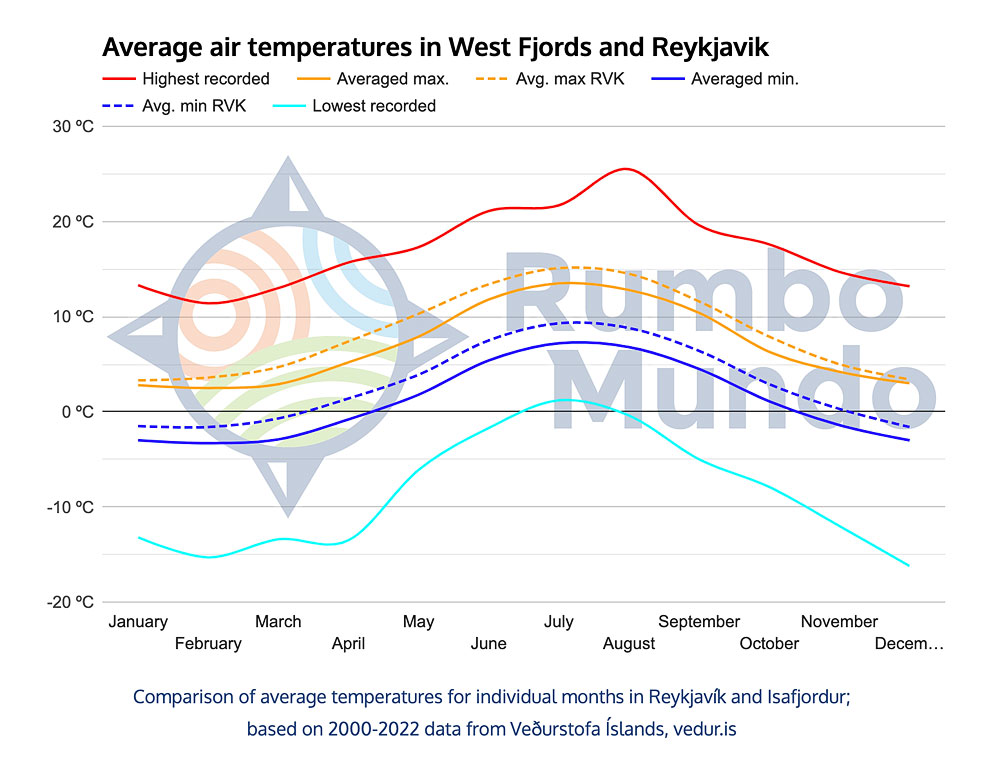
The average maximum temperature here is lower than in Reykjavik by about 0.5 °C to 2.5 °C (1 to 4.5°F) throughout the year. Minimum temperatures are about 2 °C (4°F) lower year-round. So the differences are not huge. The West Fjords are not the “cold pole” of Iceland (that pole is the interior, but more on that later).
based on 2000-2022 data from Veðurstofa Íslands, vedur.is
The Ísafjörður station does not collect information on the number of hours of sunshine or cloud cover, but based on data from other stations in the region, it is safe to say that the differences from Reykjavík are negligible in this regard.
Interestingly, the average wind strength here is also surprisingly similar to Reykjavik throughout the year. On the other hand, rainfall totals for individual months are noticeably lower than in Reykjavik from March through September, but outside of those months remain similar to the capital.
based on 2000-2022 data from Veðurstofa Íslands, vedur.is
The thickness of the snow cover and its duration are unfortunately not tracked by weather stations. But as we mentioned earlier, temperatures here drop below freezing at night for as much as half the year. Snow, especially in shaded areas – and these are not difficult to find in the mountainous fjords – therefore has excellent conditions to last very long here.
On the other hand, measuring the strength of the wind in Isafjordur is misleading, because the town is not located in a random place, but deep inside a well-hidden fjord bay, among rather high hills. Thus, it blows much less here than on the surrounding hills and passes. Isafjordur is well sheltered from the wind, but in unshielded places the wind in the West Fjords behaves differently.
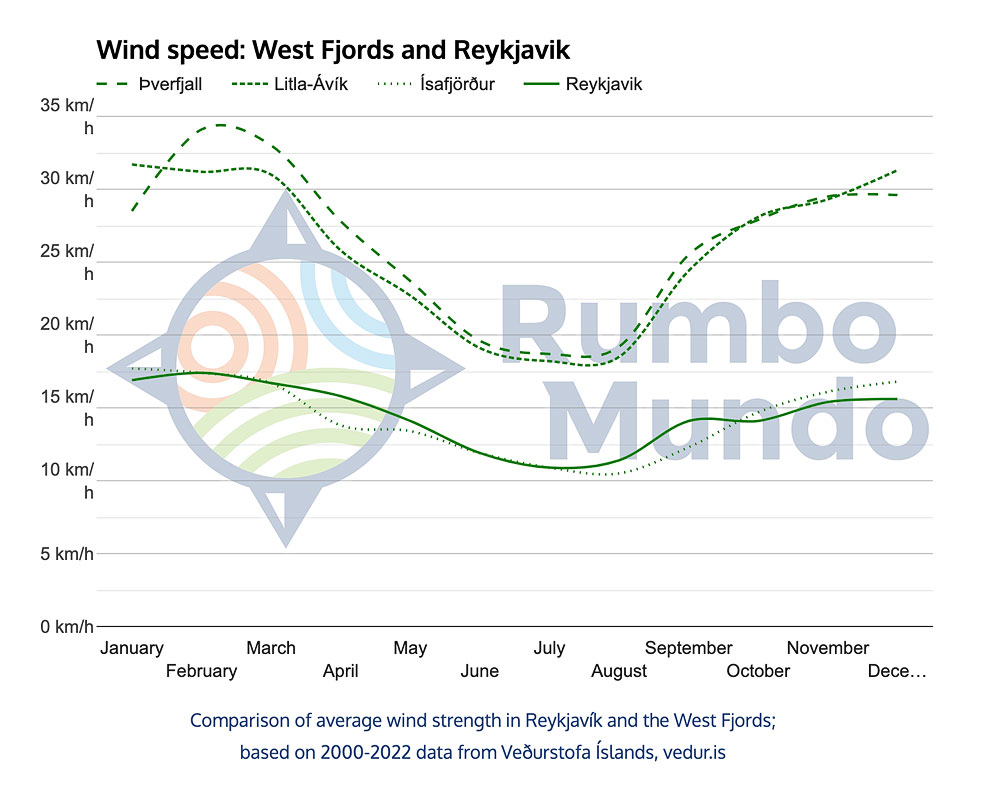
If we look at the data of the Þverfjall station located in the hills surrounding Isafjordur (only 7 km / 4 miles west of the town, but at an altitude of 741 m / 2,431 ft above sea level), the wind graph already looks quite different. Anyway, Thverfjall looks like a station more representative of the whole region in terms of wind strength, because, for example, the Litla-Ávík station located at the small Gjögurflugvöllur airport in the eastern part of the region and just above the ocean (only 15 m / 49 ft above sea level) shows very similar readings in this respect.
based on 2000-2022 data from Veðurstofa Íslands, vedur.is
Even in the month of the weakest wind – July – it blows more in the hills above Isafjordur (18.7 km/h – 11.6 mph) than in Reykjavik in the month of the highest wind (February – 17.4 km/h / 10.8 mph).
But again – these are only averages. We will only get the full picture when we also look at the extreme recorded wind speed.
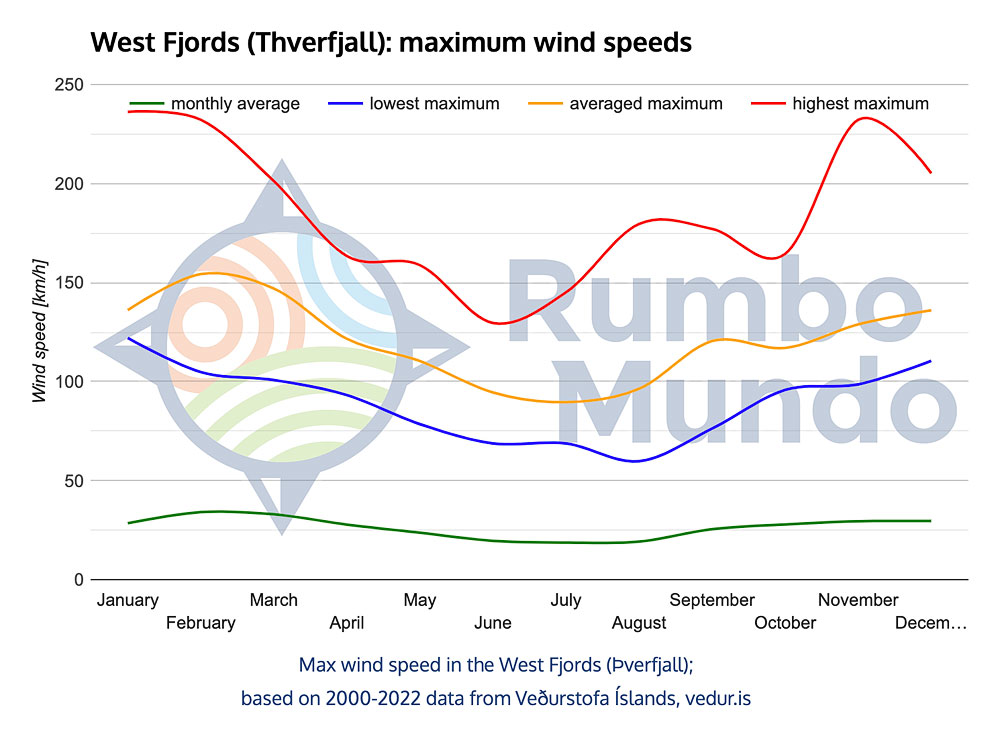
A small methodological note: the graph below was created by collecting the maximum recorded wind speeds in a given month from January 2000 to December 2022. From these values for each month (i.e., for example, for all Februaries or all Octobers), we select the highest reading, the lowest, and calculate the average of all 23 readings. For comparison, we also include the monthly average shown earlier (the one 80% higher than Reykjavik). This way we get the data as below:
based on 2000-2022 data from Veðurstofa Íslands, vedur.is
The highest wind speeds ever recorded here exceed 230 km/h (143 mph) in as many as three months, and 200 km/h (125 mph) in five (November through March). But these, in turn, are extremes that (cautious) tourists do not encounter, because red alerts are issued before such storms and it is strongly suggested to leave the region quickly. During such strong storms, of course, the roads are closed, but even so, no one would think of leaving home at that time. However, it is worth remembering that such winds also happen here.
On the other hand, perhaps the most shocking is the blue line on the graph. That’s the line showing the “lowest maximum” from 2000 to 2022. If for each month between 2000 and 2022 we take the HIGHEST wind speed recorded in that month, but then see which was the LOWEST during those 23 years, we find that those results from December to March exceed 100 km/h (62 mph)! That is, every year, in each of these months, the Thverfjall station in the West Fjords recorded wind speeds exceeding 100 km/h (62 mph) at least once. In addition, also in April, October and November these minima were above 90 km/h (56 mph). From the perspective of Iceland’s capital, the storm actually lasts twelve months in the West Fjords…
The roads in the West Fjords are mostly routed along the coast, an area where the weather is similar to Isafjordur. However, if you want to go around the region, at least twice you have to cross passes lying more than 400 m (1,300 ft) above sea level. One of these places is near the junction of roads 61 and 608, and the other at the junction of roads 60 and 63. And if you want to visit the Raudasandur beach and Latrabjarg cliffs, then you will go over 400 m (1,300 ft) above sea level for the third time on Road 62 (and over 360 m / 1,180 ft above sea level once again on Road 614). Getting over these passes is the main problem in moving through the West Fjords in winter (that is, from November to April!).
Very strong winds, long-lasting snow and several dangerous passes make it necessary to plan a trip to the West Fjords, at least from autumn to spring, with extreme caution.
You can read about what to see when going to this beautiful corner of Iceland here: What to see in the West Fjords.
Weather in the north of Iceland
Going clockwise, in the next step we will discuss the weather in the north, based on data from the weather station in the region’s capital, Akureyri. Like Isafjordur, this city too is tucked away in a deep fjord, and is also quite far south of Iceland’s northernmost coast. However, it is certainly the most important city in the region (and the second largest city in Iceland), so we will use it as a benchmark for the entire north.
You can read about the attractions and most interesting places to visit in northern Iceland here: Attractions in northern Iceland.
In terms of temperatures, Akureyri is quite similar to Reykjavik. The average maximum temperatures of each month here differ by no more than 1 °C (2°F), the average minimum temperatures by no more than 2 °C (4°F). Both are lower in winter but higher in summer than in Reykjavik.
based on 2000-2022 data from Veðurstofa Íslands, vedur.is
As well as air temperature, other weather factors behave similarly to Reykjavik in Akureyri, although of course they differ somewhat. What certainly stands out is the number of hours of sunshine, which drops to practically zero here in December and January.
Remember that the number of hours of sunshine is not the same as the length of the day. In winter, a day in Akureyri lasts only 3 h 5 min, but in summer it is as long as 23 h 32 min [source: Einarsson]. That’s 1 h less and 2.5 h more than in Reykjavik, respectively.
The precipitation minimum here comes slightly earlier than in Reykjavik, from April to June, and takes noticeably lower values. June’s minimum of 19.8 mm (0.8 in) is less than half of the lowest monthly rainfall in Reykjavik (45.7 mm / 1.8 in).
based on 2000-2022 data from Veðurstofa Íslands, vedur.is
The best way to visit northern Iceland is on a tour around the island. Due to the cost and weather, the best time for such a trip is May and June (July and August are clearly more expensive). The detailed plan for such a trip can be found here: Spring Iceland trip itinerary: 7 to 13 days.
Weather in eastern Iceland
The meteorological station chosen to represent eastern Iceland is Dalatangi, which lies about 40 km (25 miles) east of the region’s capital – Egilsstadir – and is very nearly the easternmost point in Iceland. Dalatangi lies at the eastern end of Road 953, which runs past, among other things, the Klifbrekkufossar waterfall. It is on the southern shore of the fjord leading to the main port of eastern Iceland – Seyðisfjörður.
You can read about the attractions and most interesting places to visit in eastern Iceland here: Attractions in East Iceland.
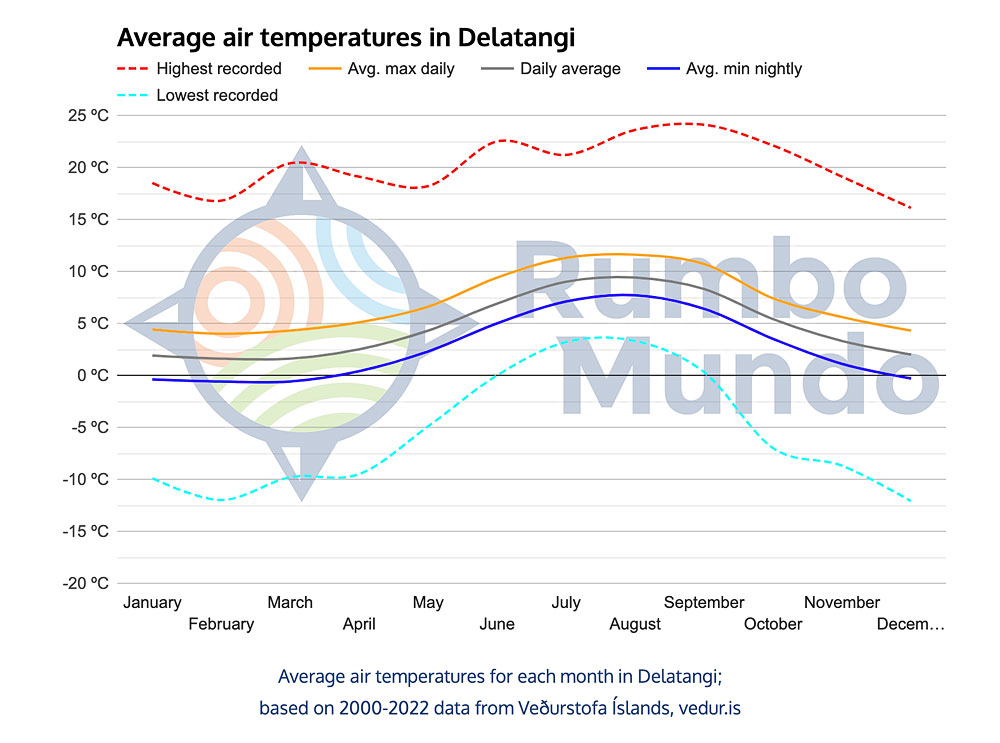
The climate of the east coast is closer to the north than to Reykjavik, but at the same time this means that it is similar to both places. In summer, the average maximum temperature here does not exceed 12 °C / 54°F (versus 15.1 °C / 59.2°F in Reykjavik), while in winter it does not fall below 4.0 °C / 39°F (versus 3.3 °C / 38°F in the capital). Minimum temperatures in winter are a bit (up to 1 °C / 2°F) higher than in the capital, and up to 2 °C (4°F) higher in summer. So these are not big differences, but one could say that the climate here is a tad more maritime.
based on 2000-2022 data from Veðurstofa Íslands, vedur.is
In contrast, the wind here is stronger than in the capital. At the same time – for most of the year, at least – it is a noticeably weaker wind than the record one at Þverfjall in the West Fjords.
based on 2000-2022 data from Veðurstofa Íslands, vedur.is
A distinguishing feature of the east coast, however, is the high precipitation.
based on 2000-2022 data from Veðurstofa Íslands, vedur.is
All months other than June record more, usually much more, rainfall in the east than any month in the capital or the northwest. October, the record month in the east, averages more than 200 mm (7.9 in) of rain (the average for the last 23 years!), while in Reykjavik no month exceeds the 100 mm (3.9 in) limit!
Weather in Iceland’s interior and highlands
Iceland’s interior is a huge area and very diverse – every day and every moment at different ends of it can have completely different weather. The Veiðivatnahraun station will serve as a landmark of the highlands, while also showing well how they differ from the rest of the island. It lies east of the F26 road, on the western slopes of the Vatnajokull glacier, about 45 km (28 miles) northeast of Hrauneyjar and also about 45 km (28 miles), but to the southwest, from Nyidalur (i.e., the almost perfect geometric center of Iceland).
You can read about the attractions and most interesting places to visit in the Icelandic interior here: List of interesting places in the interior and here: List of Interesting Places of the Icelandic Interior [Top10].
Veidivatnahraun is located at an altitude of 647 m (2,123 ft) above sea level, so at an altitude similar to the popular Landmannalaugar (about 610 m / 2,000 ft above sea level), but slightly lower than Dreki near Askja (about 780 m / 2,560 ft) or Nyidalur itself (also about 780 m / 2,560 ft). However, many mountain huts and campsites are located even higher (e.g., Fimmvörðuháls or Hrafntinnusker Hut lie at over 1,000 m / 3,300 ft above sea level).
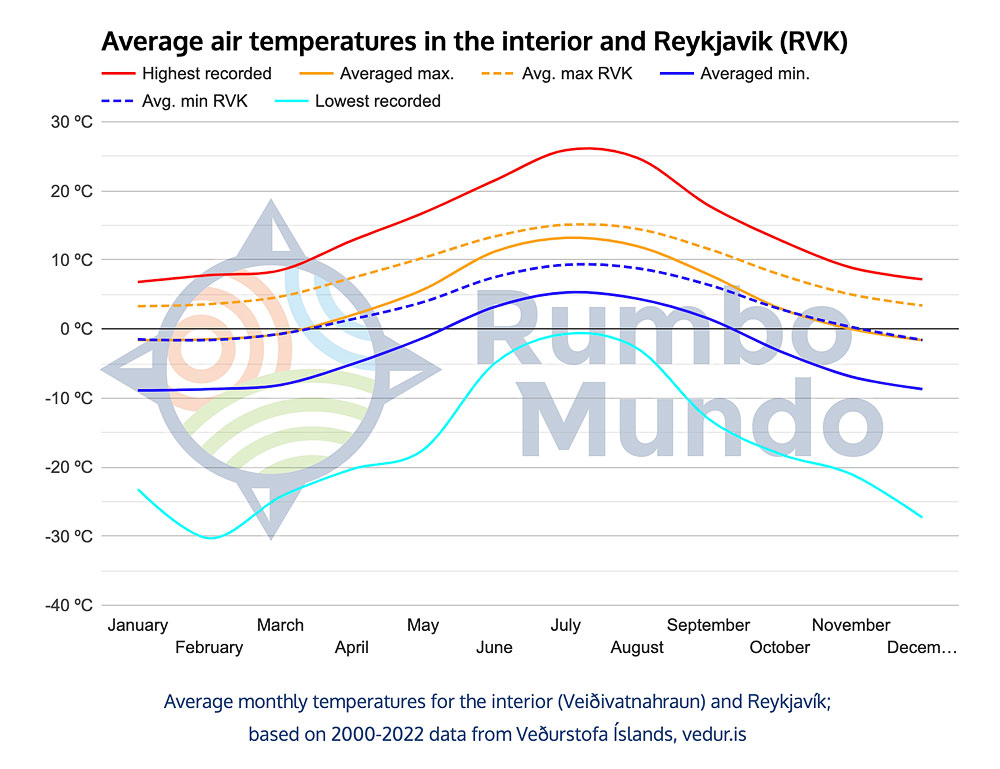
The most important characteristic of the interior is certainly the cold. From June to August, maximum temperatures here are about 2 °C (4°F) lower than in Reykjavik, and minimum temperatures are as much as 4 °C (7°F) lower. In winter, this difference even widens: the average MAXIMUM temperatures for the interior then almost perfectly coincide with the average MINIMUM temperatures in Reykjavik. However, in winter the roads to the interior are closed and it is practically very difficult to visit it then.
based on 2000-2022 data from Veðurstofa Íslands, vedur.is
The interior is also the only one of the analyzed regions where the lowest recorded temperatures fall below -20 °C (-4°F), and the record (in February 2008) even went below -30 °C (-22°F)!
The station does not collect data on cloud cover and the number of hours of sunshine, but based on data from other stations in the region, it can be seen that these factors are not significantly different from other regions in Iceland.
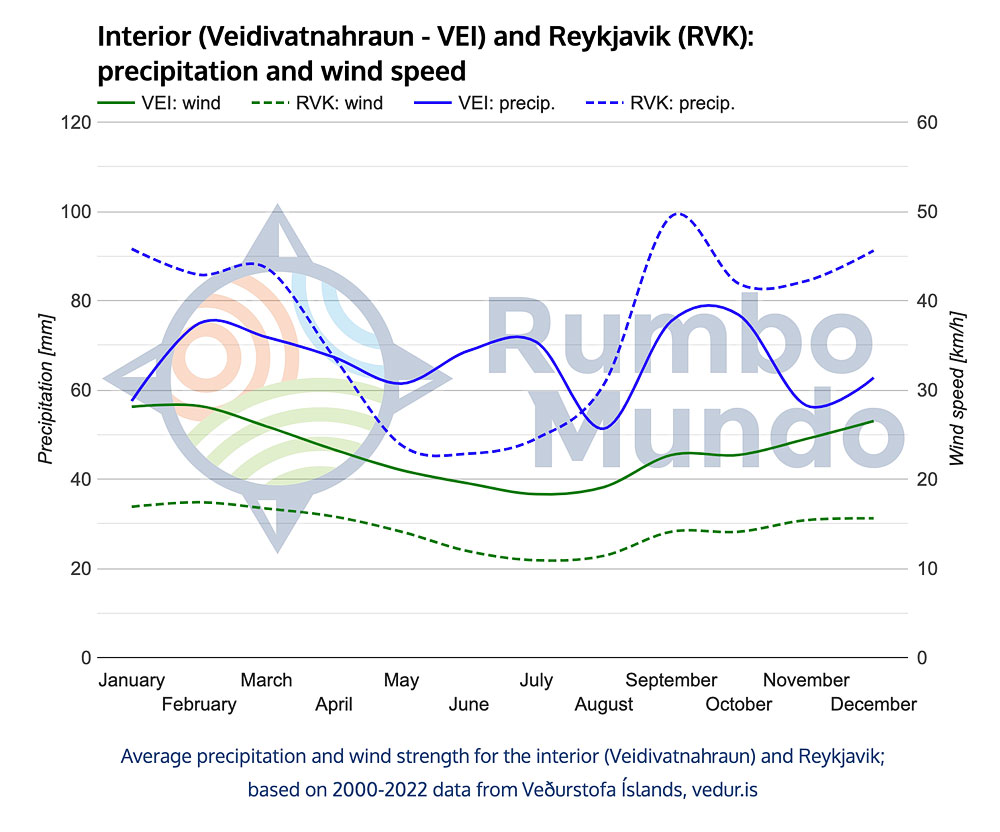
However, wind strength is higher here, and monthly precipitation totals are more even throughout the year:
based on 2000-2022 data from Veðurstofa Íslands, vedur.is
You can also see from the graph above that it really blows hard here. The average wind speed remains clearly above the readings for Reykjavik throughout the year, and at the same time at levels very similar to the Thverfjall hill in the West Fjords described earlier. Only in February and March does the interior lag behind the West Fjords in this regard, as the average wind speed here does not exceed 30 km/h (19 mph). Combined with the campsites, which sometimes lie even higher than this weather station, it is not surprising that this is where the interesting phenomenon of “nights of flying tents” is observed in summer…
The available weather data does not show one more important feature of the interior – the thickness of the snow cover and how long it lasts. The region’s inaccessibility is certainly also influenced by the fact that the roads here are exclusively gravel and often crossed by streams. And glacial rivers are deepest in summer – after all, the amount of water in them depends on the rate of glacial melt. In winter the interior is inaccessible due to snow, and in spring and summer – due to swollen streams… You can read about the most important roads in Iceland and the conditions on them here: The most important roads in Iceland.