Of course, for a climatologist, a period of 23 years is certainly not enough to determine a country’s climate on this basis. Nevertheless, a comparison of weather from the end of the 20th century and the beginning of the 21st century clearly shows the direction of change.
A separate article extensively discusses the weather that bore down on Iceland between 2000 and 2022 (see Weather in Iceland – temperature, wind, precipitation).
The year 2000 is actually still the 20th century, but compare the data shown there to the results from the end of the 20th century: the years 1977-1999 (that’s also 23 years). From the comparison, it’s clear that Iceland used to be (still) more inaccessible: colder and noticeably windier.
Changes in air temperature in Iceland
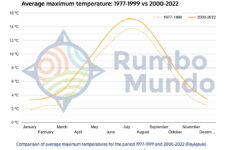
Comparison of average maximum temperatures for the period 1977-1999 and 2000-2022 (Reykjavik)
based on 1977-2022 data from Veðurstofa Íslands, vedur.isThe chart above clearly shows that Reykjavik is now warmer. The average maximum temperature is now about 1.4 °C higher on average for all months, and up to 2.0 °C for March and April. This may not look dramatic, but note that in relative terms this means that the years 2000-2022 were as much as 20.5% warmer than the years 1977-1999! (Although if temperatures were expressed in Kelvin, for example, this relative increase would obviously be much smaller.)
T
he so-called Paris Agreement commits UN countries not to allow global temperatures to rise by more than 1.5 °C. So in this context the Icelandic increase of 1.4 °C is quite a lot. The Paris Agreement does talk about average temperature (not average maximum temperature), but in this context Iceland’s temperature has also risen: by 0.6 °C, so also relatively much.
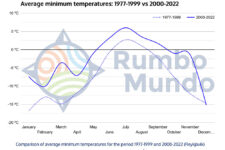
Perhaps (even) more illustrative is the graph of the lowest recorded temperatures. The minima recorded in the 1977-1999 period were as much as 5.5 °C lower than in the last “nearly a quarter century” (chart below). The record difference on the chart (March) was as much as 11.3 °C.
Comparison of average minimum temperatures for the period 1977-1999 and 2000-2022 (Reykjavik)
based on 1977-2022 data from Veðurstofa Íslands, vedur.isChanges in wind strength in Iceland
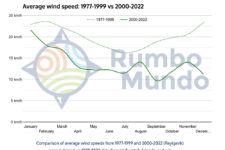
The recorded average wind speed, on the other hand, is now just over 6 km/h (3.7 mph) lower. Again: 6 km/h may look inconspicuous, but in relative terms it’s a drop of more than 30%!
Comparison of average wind speeds from 1977-1999 and 2000-2022 (Reykjavik)
based on 1977-2022 data from Veðurstofa Íslands, vedur.is
I
celand has become warmer and less windy. If it wasn’t for the melting glaciers and the impending climate catastrophe, this could probably be considered a favorable change…
20th vs 21st century – meteograms


